Frame Rate Looks Fine, So Why Does Your Spatial App Feel Like Molasses?

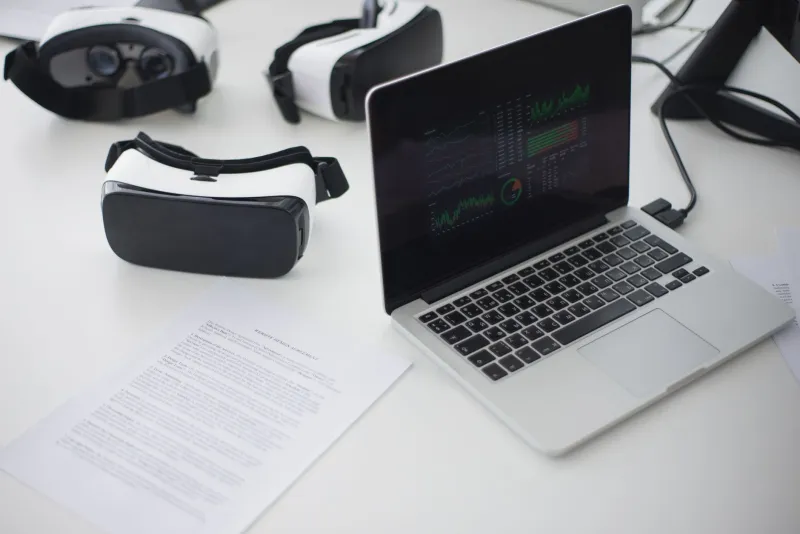
Here's a scenario that'll feel painfully familiar to anyone who's shipped a spatial web experience: your performance metrics look clean. Chrome DevTools reports a smooth 60 frames per second. Your Lighthouse score is respectable. And yet, the moment a real user puts on a headset or drags an object across your surface interface, they describe the experience as "laggy," "sticky," or—everyone's favorite—"kind of gross to use."
Welcome to the invisible bottleneck problem. It's one of the most frustrating corners of spatial web development, and it's more common than anyone in this space likes to admit.
The core issue is that raw frame rate is a terrible proxy for perceived responsiveness in spatial applications. When you're building for flat screens, fps-as-a-metric gets you pretty far. In three-dimensional, touch-driven, or mixed reality contexts, there are a half-dozen other variables quietly sabotaging the user experience while your profiler sits there looking smug.
Let's get into the actual culprits.
The Scene Graph Is Probably a Mess (Even If It Looks Tidy)
Most developers building with Three.js, Babylon.js, or A-Frame understand the basics of scene graph management—keep your node count reasonable, dispose of geometries you're not using, merge static meshes where you can. But the subtler traps live in how the scene is traversed at runtime, not just how it's structured at load time.
Every frame, your renderer walks the scene graph to determine what needs to be drawn. If you've got deeply nested object hierarchies—even with relatively few total nodes—that traversal cost compounds quickly. A scene with 200 nodes structured five levels deep can easily outperform a poorly structured scene with 80 nodes scattered across unnecessary parent containers.
The fix here isn't just "flatten your hierarchy" (though that helps). It's profiling the traversal itself. In Three.js, you can instrument renderer.info to track draw calls per frame. If that number spikes during specific interactions—say, when a user picks up an object or a new panel animates in—you've found your scene graph tax.
Real-world example: a team building a spatial product configurator noticed their app felt sluggish when users rotated assembled product models. Frame rate held at 58-60fps consistently. The problem? Each component of the product was its own independently animated mesh with its own matrix update cycle. Consolidating static sub-components into instanced meshes dropped their per-frame matrix computation time by 40%, and the "stickiness" users reported disappeared entirely.
Physics Engines Are Lying to You About Their Cost
If your spatial app includes any physics simulation—even something as simple as object collision detection or gravity for dropped items—you're carrying overhead that most developers wildly underestimate.
Physics engines like Cannon.js or Rapier run their simulation on a fixed timestep, which is good for consistency but creates a subtle problem: when your render loop and physics loop fall out of sync, you get interpolation artifacts. Objects appear to "snap" between positions rather than moving fluidly. Users don't describe this as a physics bug. They describe it as the app feeling "off" or "cheap."
The standard advice is to decouple your physics timestep from your render loop and interpolate positions between physics steps. That's correct. But the less-discussed issue is what you're actually simulating. Many developers add physics to objects that don't need full rigid-body simulation. If an object is just going to sit on a surface and occasionally get tapped, you don't need a full physics body. A kinematic body or even a simple raycasted placement check will feel identical to the user and cost a fraction of the computation.
Audit your physics world object count. In Cannon.js, world.bodies.length should make you nervous if it's above 50 in a typical scene. Prune aggressively. Sleep thresholds are your friend—objects that haven't moved recently should be put to sleep and excluded from the simulation step.
The GPU Is Bored While the CPU Panics
Here's a bottleneck pattern that shows up constantly in spatial apps: the GPU is sitting around underutilized while the CPU is absolutely maxed out handling JavaScript logic, and the whole thing looks fine in a naive performance trace because the GPU timeline appears busy.
This happens when developers offload too much to the main thread. Collision detection logic in JavaScript, per-frame DOM manipulation for UI overlays, heavy state management libraries re-rendering on every animation frame—these are CPU-bound operations that block the rendering pipeline even when the GPU has spare capacity.
The diagnostic move here is to look at your Chrome Performance panel's "Main" thread timeline during an interaction. If you see long yellow JavaScript tasks—anything over 4-5ms—running during your animation frame, that's your problem. The frame isn't getting to the GPU fast enough to maintain perceived smoothness, even if the GPU could handle double the workload.
Web Workers are the obvious solution for offloading heavy computation. But the bigger architectural fix is reconsidering what actually needs to happen per-frame. Most state updates don't. Most UI logic doesn't. Spatial apps often inherit the reactive-update-everything patterns from web app development, and those patterns are genuinely toxic at 90fps.
Texture Memory Is a Silent Frame Budget Thief
This one gets developers every single time. You've compressed your textures, you've used appropriate formats—KTX2 with Basis compression if you're doing this right—and you've kept individual texture sizes reasonable. But your app still hitches during scene transitions or when new objects load.
The issue is usually texture upload timing. Even a properly compressed texture has to be uploaded to the GPU, and that upload happens synchronously on the main thread by default in WebGL. If you're loading multiple textures at once—say, when a new section of a spatial environment loads—you'll see frame spikes that have nothing to do with rendering complexity.
The solution is progressive texture loading with explicit upload scheduling. Three.js's renderer.initTexture() lets you pre-upload textures to the GPU before they're needed in the scene. Building a preloading queue that uploads textures during idle frames—using requestIdleCallback or a manual frame budget check—can eliminate those hitches entirely.
Profiling the Feeling, Not Just the Numbers
The meta-lesson across all of these is that spatial app performance requires a different mental model for profiling. You're not just chasing fps. You're chasing perceived input latency, motion smoothness, and interaction predictability—metrics that don't have clean dashboard representations.
The most useful technique is building internal performance overlays that surface the metrics that actually matter: physics step time, scene graph traversal time, texture upload queue depth, and main thread idle percentage. Tools like stats.js give you a starting point, but you'll likely need custom instrumentation.
And honestly? The most reliable signal is still a real user with a headset or a touch-enabled surface device, describing in plain language what feels wrong. "Sticky," "laggy," and "gross" are data points. Learn to translate them back into profiler queries, and the invisible bottlenecks stop being invisible pretty fast.